Tag Archives: JavaScript

Alkulauseita

Helsingin Sanomat julkaisi viime vuoden lopulla listan (vain tilaajille) 2000-luvun 100 parhaasta suomalaisesta kirjasta. Silmäilin minäkin. Heti alkuun totesin, että olen lukenut niistä vain neljä.

Sitten aloin fundeerata. Listan pohjalta voisi viritellä jotakin pientä projektia. Vaikka pienimuotoista koodailua olenkin harrastanut, en ole koskaan tehnyt mitään, mitä voisi etäisestikään kutsua peliksi. Olisiko tässä ainesta?

Tartuin ensimmäiseen ideantynkään ja ryhdyin keräämään kirjoista niiden alun. Tarkkaan ottaen ensimmäisen virkkeen. Sen, millä tarina käynnistyy. Olipa kerran. Tämä jos mikä on helppo duuni, arvelin, hiukan työläs ja mekaaninen tosin.

Toisin kävi. Miten harva onkaan se teos, jossa nimiösivun jälkeen ei ole mitään etkoa! On alkusanoja, mottoa, aforismia, tarinaa, historiaa… Epigrafien tarkoituksena on selittää niiden esineiden merkitystä, joihin ne on piirretty. Mielenkiintoista, miten runsaasti kirjaesineen merkitystä selitetään. Vai onko tässä kyse samasta funktiosta kuin elokuvan ääniraidalla, joka lisää katselukokemukseen tunnelmaa? Onko alkutekstin tarkoitus viipyillä lukijan mielessä pitkäänkin? Asetetaanko sillä odotusarvo? Niitä lukiessa rapistellaan popcornit esiin?

Ensimmäisyys kirjassa on siis aika lailla suhteellinen käsite. Päätin ottaa sen linjan, että heti kun olen erottavinani kirjailijan oman äänen, se olkoon myös koko kirjan aloitus. Kiitossanat hyppäsin yli.

Ei muotokaan mikään yksiselitteinen asia ole. Virkkeen kuuluisi lopulta törmätä johonkin konkreettiseen kuten piste, mutta tässäkin listassa oli koko joukko kirjoja, joissa näin ei tapahdu. Runous on tietysti selvä tapaus, mutta runouden ja proosan välissä on paljon tilaa. Muutamassa teoksessa ensimmäinen piste häämötti vasta useamman pilkun tuolla puolen. Aina kun en tiennyt mitä tehdä, pätkäisin vaan ronskisti mukaan edes jonkin verran. Pahoittelut tästä.

Helsingin yliopiston Kaisa-talon kirjastossa suomenkielinen kaunokirjallisuus on kerroksessa K3. Reilussa tunnissa olin käynyt läpi hyllyistä löytyneet listan teokset. Noin kolmasosa. Sen jälkeen istuin Kansalliskirjaston vapaakappaletyöasemalla suunnilleen yhtä pitkän rupeaman; uudemmista teoksista on varsin usein myös elektroninen vapaakappale. Bonuksena äkkäsin yhden, joka ei ollut Varia-kokoelmassa, toisin kuin Finna-hakupalvelu kertoi. Muutamassa tunnissa Vapaakappalepalvelut korjasi senkin poikkeaman.

Jäljelle jäi noin tusina nimekettä, joista valtaosa oli paikalla Suomalaisen Kirjallisuuden Seuran kirjastossa Hallituskadulla. Hotakaisen Juoksuhaudantie on omassa kirjahyllyssä kotona, loput laitoin varaukseen kirjastoista. Yli-Juonikkaan Neuromaanin jouduin tosin tilaamaan Kansalliskirjaston erikoislukusaliin, koska varausjonot olivat kaikkialla pääkaupunkiseudulla niin pitkät.

Eipä aikaakaan, niin materiaali oli kasassa.

Päätin tehdä pelin, jossa arvuutellaan, mikä lause kuuluu mihinkin kirjaan. Ei ollenkaan ainutlaatuinen idea (ks. vaikka tämä), mutta halusin oppia jotakin interaktiivisuuden toteuttamisesta verkossa. Lyhyesti: miten raahata palikoita paikasta toiseen. Kaikki tähänastinen vuorovaikutteisuus, jonka olen päästänyt käsistäni, on nojannut Shiny-tekniikkaan. Shiny on integroitu ohjelmoinnin tukiympäristö, framework. Se on palvellut hyvin, koska en ole kiinnostunut verkkosivujen tyylitietojen virittelystä (enkä sitä paitsi osaisikaan) ja JavaScript-tietämys on taaperotasoa. Siinä missä toiset oppivat kävelemään ja porttaamaan JavaScriptillä Doom-pelin PDF:lle, minä saatan kehittyä konttaamisessa, en juuri enempää.

Otin opettajaksi ja työkaveriksi ChatGPT 4o minin, joka palvelee ilman tilausta ja kirjautumista. Koodin lähtökohta oli ns. natiivi JavaScript, jos vain mahdollista. Erinäisten iterointien ja yritys-erehdys-vaiheiden jälkeen tuloksena on kohtuullisesti toimiva prototyyppi. Raahaus onnistuu muilla kotoa löytyvillä välineillä ja selaimilla paitsi Androidin Firefoxilla. Oikeat ja väärät vastaukset erottuvat kuten oli tarkoitus, ja saman istunnon peräkkäisten pelikertojen pohjalta lasketaan kokonaispistemäärä. Virhetilanteiden ennakointia en viitsinyt vielä pidemmälle, joten pientä epäloogisuutta löytyy.

Pelin ulkonäkö on karu ja siksi varmaan jääkin. Raahaaminen olisi kyllä mukavampaa, jos lauseet olisivat samalla tasolla nimien kanssa, ei niiden alla, koska nyt saattaa joutua vierittämään. Laatikoiden tiivistyskään ei olisi pahitteeksi.

Kertaalleen erehdyin pyytämään CSS-vinkkejä ulkoasun kohentamiseksi, jolloin ChatGPT:lla lähti heti lapasesta. Palasin takaisin. Yritin myös löytää tapaa korvata systeemitason varoitusikkuna, joka pongahtaa tylyn näköisenä esiin kun pyytää tuloksen. Siltäkin sivupolulta pakitin, koska modal-ikkunointi on outoa ja vierasta, enkä tajunnut mitä ChatGPT:n koodi sillä oikein teki. Oli mitä oli, ei ainakaan toiminut.

Aloitetaan vaikka tästä.
About 43000 results

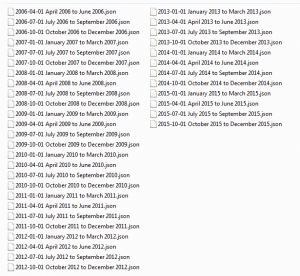
Since few days now, I’ve had my Google search archive with me. In my case, it’s a collection of 38 JSON files, containing search strings and timestamps. The oldest file dates back to mid-2006, which acts as a digital marriage certificate of us, me and the Internet giant.

JSON files of Google search archive

It took no more than 15 minutes for Google to fulfill my wish to get the archive as a zipped file. For more information on How & Where, see e.g. Google now lets you export your search history.

Now, this whole archive business started when I was led to a very nice blog posting by Lisa Charlotte Rost
.

Tweet about Lisa Charlotte Rost

I find it fascinating, what you can tell about a person just by looking at her searches. Or rather, what kind of narratives s/he builds upon them; to publish all search strings verbatim is not really an option.

Halfway in the 4-week course Intermediate D3 for Data Visualization, the theme is stacked charts. Maybe I could visualize, on a timeline, as a stacked area chart, some aspects of my search activity. But what aspects? What sort of person am I as a searcher?

Quite dull, I have to admit. No major or controversial hobbies, no burning desire to follow latest gadgets, only mildly hypocondriac, not much interest at all in self-help advisory. Wikipedia is probably my number one landing site. Very often I use Google simply as a text corpus, an evidence-based dictionary:”Has this English word/idiom been used in the UK or did I just made it up, or misspelled?” Unlike Lisa, who tells in episode #61 of the Data Stories podcast that now when she lives in a big city, Berlin, she often searches for directions – I do not. Well, compared to Berlin, Helsinki do is small, but we also have a superb web service for guiding us around here, Journey Planner. So instead of a search, I’ll go straight there.

One area of digital life I’ve been increasingly interested in – and what this blog and my job blog reflect, too, I hope – is coding. Note, “coding” not as in building software but as in scripting, mashupping, visualizing. Small-scale, proof-of-concept data wrangling. Learning by doing. Part of it is of course related to my day job at Aalto University. For example, now when we are setting up a CRIS system, I’ve been transforming, with XSLT, legacy publication metadata to XML. It needs to validate against the Elsevier Pure XML Schema before it can be imported.

A few years now, appart XSLT, the other languages I have been writing with, are R and Perl. Unix command line tools I use on a daily basis. Thanks to the D3 course, I’m also slowly starting to get familiar with JavaScript. Python has been on my list a longer time, but since the introductory course I took at CSC – IT Center for Science some time ago, I haven’t really touched it.

I’m not the only one that googles while coding. Mostly it’s about a specific problem: I need to accomplish something but cannot remember or don’t know, how. When you are not a full-time coder, you forget details easily. Or, you get an error message you cannot understand. Whatever.

Are my coding habits visible in the search history? If yes, in what way.

First thing to do with the JSON files, was to merge them into one. For this, I turned to R.

library(jsonlite)
 
filenames <- list.files("Searches", pattern="*.json", full.names=TRUE)
jsons.as.list <- lapply(filenames, function(f) fromJSON(txt = f))
alljson <- toJSON(jsons.as.list)
write(alljson, file = "g.json")

Then, just as Lisa did, I fired up Google Refine, and opened a new project on g.json.

To do:

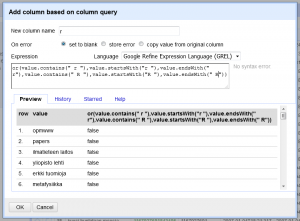
  • add Boolean value columns for JavaScript, XSLT (including XPath), Python, Perl and R by filtering the query column with the respective search string
  • convert Unix timestamps to Date/Time (Epoch time to Date/Time as String). For now, I’m only interested in date, not time of day
  • export all Boolean columns and Date to CSV

Google Refine new column

From the language names, R is the most tricky one to filter because it is just one character. Therefore, I need to build a longish Boolean or sentence for that.

Google Refine text facet

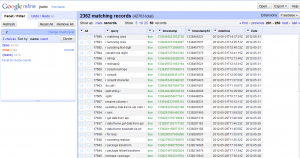
Here I’m ready with R and Date, and checking the results with a text facet on the column r.

Thanks to a clearly commented template by the D3 course leader, Scott Murray, the stacked area chart was easy to do, but only after I had figured out how to process and aggregate yearly counts by language. Guess what – I googled for a hint, and got it. The trick was, while looping over all rows by language, to define an object to store counts by year. Then, for every key (=year), I could push values to the dataset array.

Do the colors of the chart ring a bell? I’m a Wes Anderson fan, and have waited for an excuse to make use of some of the color palette implementations of his films. This 5-color selection represents The Life Aquatic With Steve Zissou. The blues and browns are perhaps a little too close to each other, especially when used as inline font color, but anyway.

Quite an R mountain there to climb, eh? It all started during the ELAG 2012 conference in Palma, Spain. Back then I was still working at the Aalto University Library. I had read a little about R before, but it was the pre-conference track An Introduction to R led by Harrison Dekker, that finally convinced me that I needed to learn this. I guess it was the easiness of installing packages (always a nightmare with Perl), reading in data, and quick plotting.

So what does the big amount of R searches tell? For one thing, it shows my active use of the language. At the same time though, it tells that I’ve needed a lot of help. A lot. I still do.