Helsingin Sanomat julkaisi viime vuoden lopulla listan (vain tilaajille) 2000-luvun 100 parhaasta suomalaisesta kirjasta. Silmäilin minäkin. Heti alkuun totesin, että olen lukenut niistä vain neljä.
Sitten aloin fundeerata. Listan pohjalta voisi viritellä jotakin pientä projektia. Vaikka pienimuotoista koodailua olenkin harrastanut, en ole koskaan tehnyt mitään, mitä voisi etäisestikään kutsua peliksi. Olisiko tässä ainesta?
Tartuin ensimmäiseen ideantynkään ja ryhdyin keräämään kirjoista niiden alun. Tarkkaan ottaen ensimmäisen virkkeen. Sen, millä tarina käynnistyy. Olipa kerran. Tämä jos mikä on helppo duuni, arvelin, hiukan työläs ja mekaaninen tosin.
Toisin kävi. Miten harva onkaan se teos, jossa nimiösivun jälkeen ei ole mitään etkoa! On alkusanoja, mottoa, aforismia, tarinaa, historiaa… Epigrafien tarkoituksena on selittää niiden esineiden merkitystä, joihin ne on piirretty. Mielenkiintoista, miten runsaasti kirjaesineen merkitystä selitetään. Vai onko tässä kyse samasta funktiosta kuin elokuvan ääniraidalla, joka lisää katselukokemukseen tunnelmaa? Onko alkutekstin tarkoitus viipyillä lukijan mielessä pitkäänkin? Asetetaanko sillä odotusarvo? Niitä lukiessa rapistellaan popcornit esiin?
Ensimmäisyys kirjassa on siis aika lailla suhteellinen käsite. Päätin ottaa sen linjan, että heti kun olen erottavinani kirjailijan oman äänen, se olkoon myös koko kirjan aloitus. Kiitossanat hyppäsin yli.
Ei muotokaan mikään yksiselitteinen asia ole. Virkkeen kuuluisi lopulta törmätä johonkin konkreettiseen kuten piste, mutta tässäkin listassa oli koko joukko kirjoja, joissa näin ei tapahdu. Runous on tietysti selvä tapaus, mutta runouden ja proosan välissä on paljon tilaa. Muutamassa teoksessa ensimmäinen piste häämötti vasta useamman pilkun tuolla puolen. Aina kun en tiennyt mitä tehdä, pätkäisin vaan ronskisti mukaan edes jonkin verran. Pahoittelut tästä.
Helsingin yliopiston Kaisa-talon kirjastossa suomenkielinen kaunokirjallisuus on kerroksessa K3. Reilussa tunnissa olin käynyt läpi hyllyistä löytyneet listan teokset. Noin kolmasosa. Sen jälkeen istuin Kansalliskirjaston vapaakappaletyöasemalla suunnilleen yhtä pitkän rupeaman; uudemmista teoksista on varsin usein myös elektroninen vapaakappale. Bonuksena äkkäsin yhden, joka ei ollut Varia-kokoelmassa, toisin kuin Finna-hakupalvelu kertoi. Muutamassa tunnissa Vapaakappalepalvelut korjasi senkin poikkeaman.
Jäljelle jäi noin tusina nimekettä, joista valtaosa oli paikalla Suomalaisen Kirjallisuuden Seuran kirjastossa Hallituskadulla. Hotakaisen Juoksuhaudantie on omassa kirjahyllyssä kotona, loput laitoin varaukseen kirjastoista. Yli-Juonikkaan Neuromaanin jouduin tosin tilaamaan Kansalliskirjaston erikoislukusaliin, koska varausjonot olivat kaikkialla pääkaupunkiseudulla niin pitkät.
Eipä aikaakaan, niin materiaali oli kasassa.
Päätin tehdä pelin, jossa arvuutellaan, mikä lause kuuluu mihinkin kirjaan. Ei ollenkaan ainutlaatuinen idea (ks. vaikka tämä), mutta halusin oppia jotakin interaktiivisuuden toteuttamisesta verkossa. Lyhyesti: miten raahata palikoita paikasta toiseen. Kaikki tähänastinen vuorovaikutteisuus, jonka olen päästänyt käsistäni, on nojannut Shiny-tekniikkaan. Shiny on integroitu ohjelmoinnin tukiympäristö, framework. Se on palvellut hyvin, koska en ole kiinnostunut verkkosivujen tyylitietojen virittelystä (enkä sitä paitsi osaisikaan) ja JavaScript-tietämys on taaperotasoa. Siinä missä toiset oppivat kävelemään ja porttaamaan JavaScriptillä Doom-pelin PDF:lle, minä saatan kehittyä konttaamisessa, en juuri enempää.
Otin opettajaksi ja työkaveriksi ChatGPT 4o minin, joka palvelee ilman tilausta ja kirjautumista. Koodin lähtökohta oli ns. natiivi JavaScript, jos vain mahdollista. Erinäisten iterointien ja yritys-erehdys-vaiheiden jälkeen tuloksena on kohtuullisesti toimiva prototyyppi. Raahaus onnistuu muilla kotoa löytyvillä välineillä ja selaimilla paitsi Androidin Firefoxilla. Oikeat ja väärät vastaukset erottuvat kuten oli tarkoitus, ja saman istunnon peräkkäisten pelikertojen pohjalta lasketaan kokonaispistemäärä. Virhetilanteiden ennakointia en viitsinyt vielä pidemmälle, joten pientä epäloogisuutta löytyy.
Pelin ulkonäkö on karu ja siksi varmaan jääkin. Raahaaminen olisi kyllä mukavampaa, jos lauseet olisivat samalla tasolla nimien kanssa, ei niiden alla, koska nyt saattaa joutua vierittämään. Laatikoiden tiivistyskään ei olisi pahitteeksi.
Kertaalleen erehdyin pyytämään CSS-vinkkejä ulkoasun kohentamiseksi, jolloin ChatGPT:lla lähti heti lapasesta. Palasin takaisin. Yritin myös löytää tapaa korvata systeemitason varoitusikkuna, joka pongahtaa tylyn näköisenä esiin kun pyytää tuloksen. Siltäkin sivupolulta pakitin, koska modal-ikkunointi on outoa ja vierasta, enkä tajunnut mitä ChatGPT:n koodi sillä oikein teki. Oli mitä oli, ei ainakaan toiminut.
Yhteenveto Solita-yhtiön toistaiseksi kolmiosaisesta YouTube-keskustelusarjasta, jossa on aiheena tekoäly sovelluskehitysprojektissa. Keskustelijat ovat Sami Köykkä ja Marko Taipale. Videot julkaistaan yrityksen kanavalla Discovering, uncovering and hype-busting GenAI
Videoiden esittelyteksti, joka kertoo taustat:
Solita and ISS have initiated the world’s first comparative study in a real consumer project to better understand the potential of GenAI. Two teams, one mission: one team uses modern, agile software development methods, and the other harnesses the power of generative AI at every step. Both are building the same ERP pricing tool but with radically different approaches. We are here to share experiences and learnings from our groundbreaking GenAI Twin project with our customer ISS, a leading facility management company. Our mission is to experiment in practice and learn fast – discover, uncover and hype-blast GenAI. What can we do with GenAI tools, and what is still hype? Where is the value?
Keskustelijat eivät kerro suoraan, mitä kaikkia tekoälytyökaluja he käyttävät. Riveiltä ja rivien välistä voi kuitenkin päätellä, että niitä ovat ainakin OpenAI:n ChatGPT, Microsoft Copilot ja arvatenkin Microsoft Azure ja sen tekoälyalusta.
Solitan tiimissä on seitsemän jäsentä. Jo nyt, prototyyppivaiheessa, ovat havainneet, että toisenlaista on. Tekoäly on auttanut esittämään keskeisiä kysymyksiä, kuten: mitä me oikeastaan olemme tekemässä? Mitä yritämme saada aikaan? Tiimiläiset syöttävät toinen toisilleen informaatiota ja tekoäly tekee raskaan työn. Vertaavat työskentelyä parviälyyn. Hyvin poikkeuksellista on se, että mukana on koko ajan myös asiakkaan edustaja. Perinteisesti asiakkaan pitäminen mukana projektissa pidempiä aikoja on ollut vaativaa.
Prototyyppivaihe on iterointia. Normaali kuuden viikon iterointisykli on nyt vain 15 minuuttia. On aikaa tehdä useita protoja ja asiakas voi valita, millä jatketaan. Voidaan jopa vaihtaa tavoitetta lennossa. Enemmän kuin kokonaisajan säästöä, aikaa käytetään korkeammalla abstratiotasolla. “Entä jos?”-kysymyksille voidaan nyt etsiä vastauksia saman tien. Normaalisti ne on kuitattava mielenkiintoisiksi mutta jätettävä, koska niihin ei ole budjetoitu eikä varattu projektiaikaa. Myös ns. “nauruversioita” voidaan tehdä. Jos niistä ei ole mihinkään, aikaa ei ole hukattu kuin muutamia minuutteja.
Keskustelijat olivat yhtä mieltä siitä, että täydellisen kehotteen (prompt) rakentelu on turhaa ajanhukkaa. Sen sijaan ihminen orkesteroi, käskyttää tekoälyä, ja edetään pienin askelin.
Jotta prototyypin käyttöliittymää päästään aloittamaan, määrittelyjen pitää yleensä olla tehtynä. Nyt voivat sen sijaan edetä seuraavasti: pyytävät tekoälyä tekemään tietomallin; sitä viilataan asiakkaan toiveiden mukaan; valmiista tietomallista syntyy oma tekoälysovelluksensa; pyytävät sitä laatimaan hyvän kehotteen käyttöliittymän tekemiseksi. Ovat siis saaneet kaksi tekoälyä keskustelemaan keskenään. Puolessa tunnissa heillä oli prototyyppi valmiina sovellustesteineen.
Tekoälyn kanssa pitää varoa kaninkoloja ja sitä, ettei tekoäly pääse niskan päälle. Sinun ihmisenä on oltava se, joka kertoo tekoälylle, mitä tehdään, ei päinvastoin. Sovelluskehitystiimissä on kuitenkin luultavasti henkilöitä kumpaankin junaan. Toisille on luontevampaa tehdä työtä käskettyä, toisille käskeä itse.
Tiimi hyödyntää tekoälyavustajia. Yksi niistä on virtuaalinen tuoteomistaja (product owner PO), jolla on syötetty kaikki projektidokumentointi. Kielimalli tietää kaiken SCRUMista, joten PO on sille tuttu käsite. Tiimi voi siis sivuuttaa aloitustason ja kysyä heti vaikka että “Mihin pystyt? Mitä voit tarjota?” Muita informaatiolähteitä, joita tekoälylle on syötetty: Slackin keskustelulokit ja litteroidut Microsoft Teams -istunnot. Mutta koska ollaan kansainvälisessä pilvipalvelussa, keskusteluista on pitänyt poistaa oikeat henkilönimet, joten pseudonymisointia varten on tehty paikallinen malli. Ideoivat myös Jira-tikettijärjestelmän rästilistan priorisointia tekoälyn avulla. Avustajat pystyvät myös ennen pitkään juttelemaan keskenään, arvioivat keskustelijat.
Avustajaa on kokeiltu myös raportoijana. Sairaslomalta palanneelle on annettu avustaja, joka on seurannut kaikkea puhuttua ja kirjoitettua. Keskustelijoiden mukaan palannut sai vajaassa puolessa tunnissa koosteet kaikesta, josta oli lomallaan jäänyt paitsi. Sami kertoi tehneensä itselleen henkilökohtaisen avustajan, jolta hän voi kysellä aina kun ei ymmärrä, mistä puhutaan. Vaikka hänellä onkin ohjelmoijatausta, hän ei hallitse kaikkia Solitassa käytettyjä tekniikoita. “Kerro minulle, mikä on .NET”. Sen, mitä tekoäly vastaa, voi aina validoita tiimin jäsenillä. Mutta kaikki apulaiset eivät ole olleet menestyksiä. Esimerkiksi “Scrum Master” osoittautui pedantiksi. Ei joustanut ja asetti aivan liian tarkkoja aikarajoja tekemiselle.
Microsoft Copilot jakaa mielipiteitä, mutta se on kieltämättä tehokas työkalu. Se tekee mm. lennossa Microsoft Teams -kokousten litteroinnin, ja sen kanssa voi saman tien aloittaa keskustelun. “Selitä minulle, mitä viimeisen viiden minuutin aikana on puhuttu.” Solitassa on testattu myös sitä, että kuuntelija on ollut päällä kokouksessa, jossa tiimiläiset eivät itse ole olleet osallisina. Sami kertoi olleensa varmuuden vuoksi itse paikalla hiljaisena osallistujana pitämässä huolta, että kaikki toimii.
Kun informaatiota syntyy runsaasti, tekoälyn nykyiset rajoitteet tulevat esiin. Asiakkaan edustaja oli ollut lounaalla puolisen tuntia ja palatessaan kysynyt tekoälyltä, mistä oli puhuttu, jolloin kuuntelija oli alkanut hallusinoida ruusuista sun muista. Koko päivän mittaisesta sessiosta se saattaa muistaa vain aamupäivän osuuden.
Solitan tiimi syöttää kaikki dokumentit tekoälylle, joka rakentaa niistä vektoritietokannan. Jos tekoälyä pyydetään esimerkiksi palauttamaan jonkin tietyn asian keskeiset tekstikappaleet, tekoäly kerää niitä kannasta tietyn määrän. Oikeat kappaleet eivät välttämättä kuitenkaan sisälly juuri niihin. Ongelmaa voi yrittää kiertää kehotteen muistilla: teet valtavan kehotteen, jossa on koko materiaali ja kysymys perässä. Mutta se ei ole kestävää kehitystä. Sitä paitsi, jos käytät maksullista tekoälyä, iso kehote tulee kalliiksi. Kehote, jossa on mukana kokonainen kirja, maksaa kolmisen euroa joka kerta.
[…] a very fancy acronym for a very simple trick. It stands for retrieval augmented generation. All it means is the user asks a question, you search your documentation for things that might be relevant to that question. You copy and paste the whole lot into the model, and these models can take quite a lot of input now, and then put the user’s question at the end. That’s it. Super, super simple.
Yeah, so RAG, it’s the Hello World of building software on top of LLMs. You don’t get it to print Hello World, you get it to answer questions about your documentation. I’ve implemented like 30 lines of Python. I’ve got one version that’s like two dozen lines of Bash, I think.
It’s very easy to get the basic version working, but getting good RAG working is incredibly difficult because the problem is that if you built the system and you know how it works, you are naturally going to ask questions of it in the right kind of format.
The moment you expose it to real human beings, they will come up with an infinite quantity of weird ways that they might ask questions.
And so the art of building good RAG systems, the reason that it could take six months to actually get it production ready is figuring out, “Okay, there were all of these different ways that it can go wrong.” And the key trick in RAG is always how do we fill that context?
How do we pick the information that’s most relevant to what the user is asking, which is really hard. That’s actually like … It’s an information retrieval problem. It’s what search engineers have been trying to figure out for 30 years, and there’s a lot of depth to that field.
So RAG, just like everything else in language models, it’s fractally interesting and complicated. It’s simple at the top, and then each little aspect of it gets more and more involved the further you look.
Avustajista ei ole enää kovin pitkä matka agentteihin, jotka suorittavat tehtäviä. Alustavia testejä on jo tehty. Tiimi käytti esimerkiksi agenttia kopioimaan tekstiä avustajien välillä.
Mikä on ihmisen rooli agenttien maailmassa? Keskustelijat olivat sitä mieltä, että agentit saavat tehdä perustyöt ja ihminen voi siirtyä astetta ylemmälle tasolle, vaativampien ongelmien pariin. Vertasivat agenttia taskulaskimeen: yksikään matemaatikko ei ole menettänyt työtään siksi, että taskulaskin on keksitty. Mielenkiintoinen vertaus oli se, että tulevaisuudessa ihminen saattaisi toimia kääntäjän (compiler) roolissa: määrittelee ja selittää ongelmia tietokoneelle.
Aivan aluksi Solitan tiimi kävi tietysti läpi markkinoilla olevia tekoälytyökaluja, testasi, valitsi sopivat yms. Mutta hyvin pian alun teknisestä vaiheesta siirryttiinkin tiimipsykologiaan ja tiimin rakenteeseen. Työskentely on sekavampaa kuin mitä ennalta kuvittelisi, ei kovakoodattuja rooleja, ketterämpää kuin ketteryys.
Keskustelun ehkä mielenkiintoisin jakso koski työnjakoa.
Solitan AI-tiimissä on kaksi roolia: kuljettaja (driver) ja navigaattori. Vain kuljettajalla on tietokone, muilla ei. Navigaattorit auttavat kuljettajaa ongelman ratkaisemisessa. Rooleja kierrätetään vartin välein. Sami vertasi tätä siihen tapaan, jota hän ja kaverit käyttivät silloin kun Commodore64 ja Amiga olivat uusia: yksi istui puikoissa, toiset istuivat vieressä ja kommentoivat. Tällainen työskentely on kuitenkin niin kuluttavaa, että tiimin on pakko pitää välillä “välitunteja”.
Marko painotti psykologisen turvallisuuden tärkeyttä (psychological safety). Ketään ei arvostella. Virheet eivät ole pahaksi, koska korjausliikkeet ovat nopeita.
Kuljettaja päättää, joten roolissa on vapausastetta. Onnistumiset ovat pieniä mutta onnistumisia joka tapauksessa. Eikä kokouksia! Asiakkaillakin on tunne, että heistä on ollut hyötyä. Perinteisesti asiakkaan edustajan on täytynyt omaksua paljon informaatiota, jota sitten pikkuhiljaa käytetään kokouksissa. Nyt otetaan pieniä askelia mutta oikeassa asiayhteydessä, ja päätöksenteon sykli on nopea. Sami vertasi tekoälyä päänsisäiseen tukirankaan (mental exoskeleton).
Mikä siis muuttuu? Yksi Samin kielikuvista oli Lego-rakennussarja. Peruspalikoista siirrytään isompiin rakenteisiin, jotka koostuvat näistä peruspalikoista. Tiimin koostumus saattaa ajoittain muuttua, sitä voidaan vahvistaa projektin ulkopuolisilla, vaikka päivä kerrallaan. Testaajia, graafikkoja, tietoturvan edustajia jne. Perehdytykselle tiimistä saattaa olla paljonkin apua. Keskustelijat olivat sitä mieltä, että menestystä ei ratkaise niinkään kokemus kuin innokkuus kokeilla uutta.
Mutta sopiiko nopeatempoinen, jakamiseen perustuva, uutta kokeileva pienryhmätyöskentely kaikille? Ei sovi. Tietotyöläisissä on kuitenkin runsaasti introvertteja. Minkälainen rooli heillä siis voi olla? Solitan testiprojektissa ei nähtävästi ole tätä käytännön tosiasiaa vielä juuri käsitelty, mikä ei sinänsä ole yllätys. Marko mietti, että ainakin ajajan rooliin istumista kannattaa lykätä, jos sitä ei koe omakseen. Osallistuu ensin jonkin aikaa navigaattorina. Tiimin on myös hyvä ymmärtää hidastaa, ettei tahti kiihdy liikaa, varsinkin alussa kun innostus on suurinta. Sitäpaitsi: “Nothing bad in good old slow thinking”.
PS. Marko kertoi, miten solitalaisille oli esitelty tapaa, jolla Tesla ja SpaceX toteuttavat päivittäisessä työssään yrityksen tavoitetta. Esimerkiksi SpaceX:n päämärä on kuulemma asuttaa maailmankaikkeus 1000 vuoden kuluttua. Tästä tavoitteesta on johdettu jatkuvasti päivittyvä suorituskykymittari (KPI). SpaceX on siinä vaiheessa maailman valloitusta, että KPI tarkoittaa tällä hetkellä samaa kuin “miten saada kilo materiaa avaruuteen mahdollisimman halvalla?” Käytännössä siis raketista pyritään saamaan painoa pois.
While slowly going through the Wikidata SPARQL query examples of last year I ran across this one which draws the shortest railway link between Narvik, Norway, and Singapore. Amazing, really. What was also interesting to find out that still in October 2021, the route went via Sweden. I’m not that inclined in train networks but AFAIK the opening of Luleå-Haparanda track in the beginning of April 2021 changed this route also in Wikidata, eventually.
The news came from a tweet by James Benedict Brown, Associate Professor of Architecture at Umeå University. His travel stories are nice reading. For example, here is a thread on how he and his students traveled in Finland at ground level in summer 2022. Recently, he announced in Mastodon, that early next spring, the target will be Athens. Having the above-mentioned SPARQL query at hand, I asked Wikidata to draw me the shortest route from Umeå to Athens.
The return was 0. Wikidata does not know about a consecutive line of adjacent railway stations between these two cities. How far, in the direction of Athens, does it know these stations then? Inside the borders of Greece , one of the last stations with a clear, labelled indication of a preceding station is Didymoteicho near the Turkish border. From that station on towards Athens, the route quickly stagnates. You can run the query here Click the big Run/Play button. The query takes a few seconds to complete.
(I couldn’t help choosing the title, thank you Bowie.)
COVID-19 has come to stay with us, but we can still take a deep breath today and look back at what has happened so far. On an individual level, quite a lot of us didn’t survive. How many of these people can we found in Wikidata? What do we know about them? Let’s start closest to where I live, Europe.
The following query counts deaths by country in the Nordic countries, the EU, United Kingdom and Switzerland. It also gives the age of the youngest and oldest person in that particular group of people. Try it!
SELECT ?countryLabel (MIN(?age) AS ?youngest) (MAX(?age) AS ?oldest (COUNT(?person) AS ?deathsInCovid)
   WITH {
     SELECT DISTINCT ?country ?person ?birth_date ?death_date WHERE {
       ?person wdt:P31 wd:Q5 ;
               p:P569/psv:P569 ?birth_date_node ;
               p:P570/psv:P570 ?death_date_node ;
               wdt:P509 wd:Q84263196 ;  # cause of death: COVID-19
               wdt:P27 ?country.
       ?birth_date_node wikibase:timeValue ?birth_date .
       ?death_date_node wikibase:timeValue ?death_date .
       { ?country wdt:P361 wd:Q52062 } # Nordic countries
       UNION
       { ?country wdt:P463 wd:Q458 } # EU
       UNION
       { ?country wdt:P17 wd:Q145 } # UK
       UNION
       { ?country wdt:P17 wd:Q39 } # Switzerland
     }
    } AS %personsDeadByCovid

WHERE {
      INCLUDE %personsDeadByCovid.
      BIND(  year(?death_date) - year(?birth_date) -  if(month(?death_date)<month(?birth_date) ||  (month(?death_date)=month(?birth_date) &&  day(?death_date)<day(?birth_date)),1,0) as ?age )
      SERVICE wikibase:label { bd:serviceParam wikibase:language "[AUTO_LANGUAGE],en".  }
    }

GROUP BY ?countryLabel
ORDER BY ?countryLabel
What was the name of these 1000+ persons? What did they do for living? Did they die at a young age, or were they already old? Try it!
SELECT (SAMPLE(?countryLabel) AS ?countryOfCitizenship) ?personLabel ?age (GROUP_CONCAT(?occLabel; SEPARATOR=", ") AS ?occupations)
   WITH {
     SELECT DISTINCT ?country ?person ?birth_date ?death_date ?occ WHERE {
       ?person wdt:P31 wd:Q5 ;
               p:P569/psv:P569 ?birth_date_node ;
               p:P570/psv:P570 ?death_date_node ;
               wdt:P509 wd:Q84263196 ; # death cause is COVID-19
               wdt:P27 ?country .
               OPTIONAL { ?person wdt:P106 ?occ. }  # occupation
       ?birth_date_node wikibase:timeValue ?birth_date .
       ?death_date_node wikibase:timeValue ?death_date .
       { ?country wdt:P361 wd:Q52062 } # Nordic countries
       UNION
       { ?country wdt:P463 wd:Q458 } # EU
       UNION
       { ?country wdt:P17 wd:Q145 } # UK
       UNION
       { ?country wdt:P17 wd:Q39 } # Switzerland
     }
    } AS %personsDeadByCovid

WHERE {
      INCLUDE %personsDeadByCovid.
      BIND( year(?death_date) - year(?birth_date) -  if(month(?death_date)<month(?birth_date) ||  (month(?death_date)=month(?birth_date) &&  day(?death_date)<day(?birth_date)),1,0) as ?age )
      SERVICE wikibase:label {
         bd:serviceParam wikibase:language "[AUTO_LANGUAGE],en".
         ?person rdfs:label ?personLabel.
         ?country rdfs:label ?countryLabel.
         ?occ rdfs:label ?occLabel
       }
     }
 GROUP BY ?personLabel ?age
 ORDER BY ?countryOfCitizenship ?age
Version 2.0
Later on I noticed two things.
First, it would have been nice to have a link to the Wikipedia page of the person, if there, in some of the major European languages – or my local ones, Finnish and Swedish.
Second, the statistics query included duplicate records and thus gave incorrect counts. The enhanced versions are here and here. To run the queries with these, click this or that. (Oh the joy of naming links!)
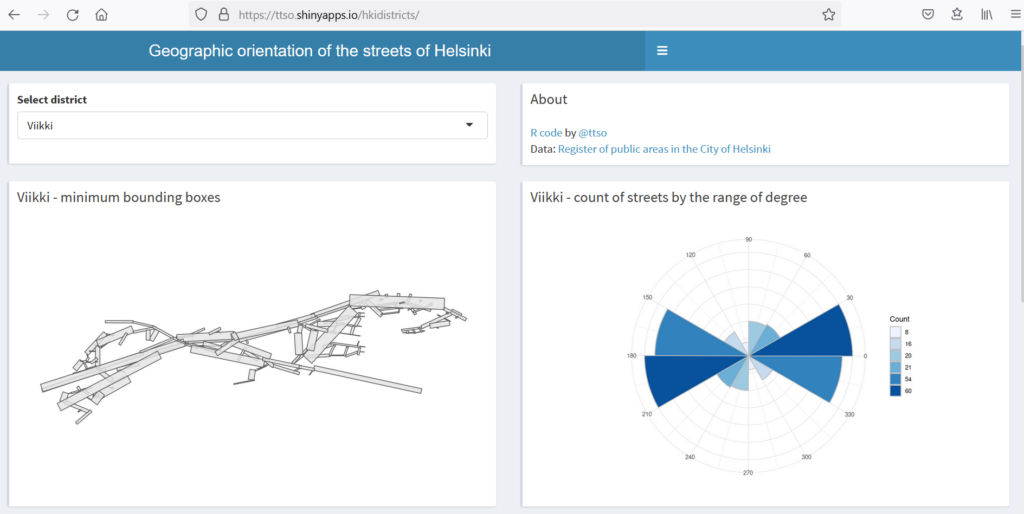
The whole exercise might seem a little silly (and probably is too) but if anything, it made me realize e.g. how the district of Viikki looks like a galloping horse when you look at its streets from this perspective.
Having done that, I used the Python library OSMnx to plot polar histograms. Here is a notebook where I tell how it went, and why Pasila is not where it should be.
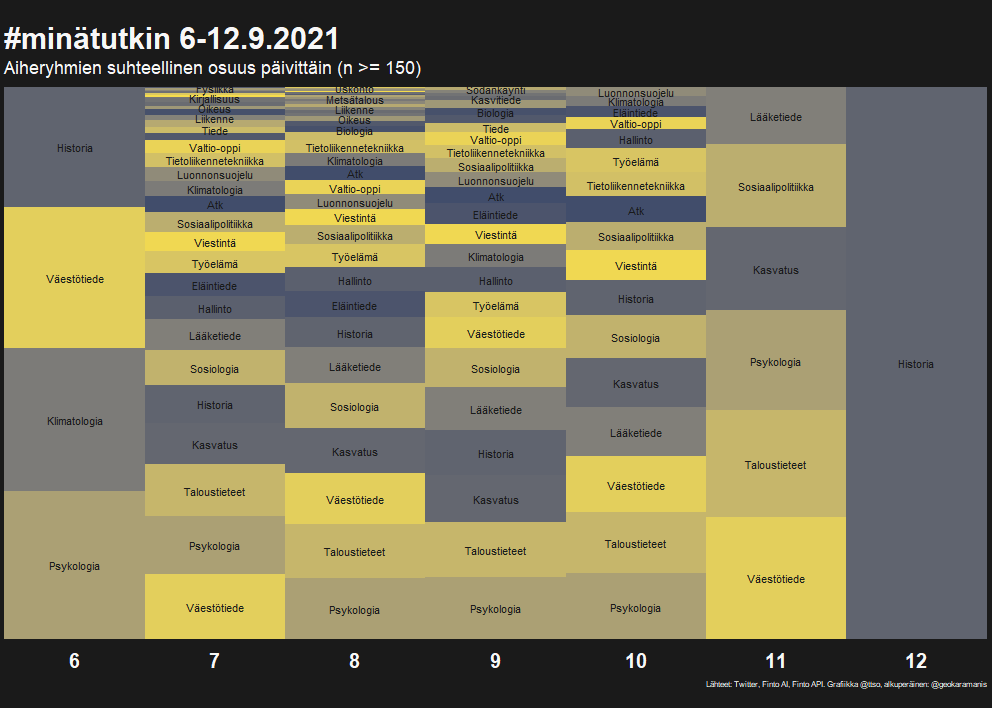
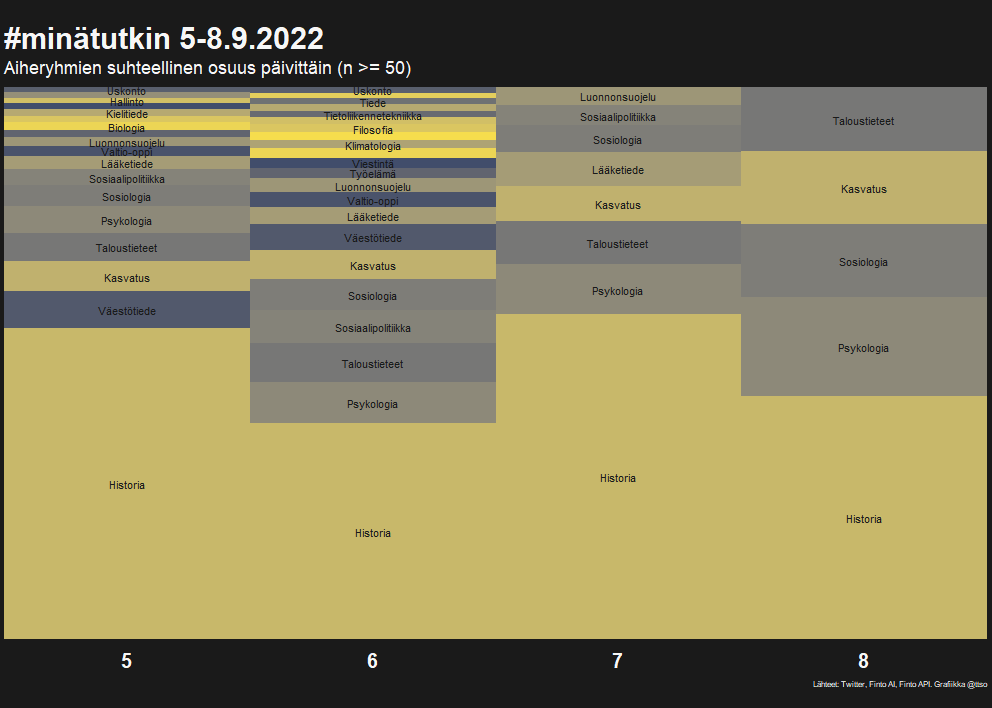
In October 2021, Finnish academic Twitter was active with the hashtag #minätutkin, My/I research. I wrote a guest posting to the rOpenGov blog (in Finnish) how I categorized these tweets by field with the help of the automatic keywording provided by Finto AI.
The image shows the proportion of the different fields by day.
A year later, the hashtag was popular again, so I re-ran the experiment and tweeted about it on September 11th.
Although I don’t belong to Aalto University staff any longer, I still maintain the Twitter bot FromA! that saw daylight in January 2015. It posts links to articles, dissertations, reports et al. published in the Aalto University publication archive https://aaltodoc.aalto.fi
The posting cycle is slightly random at the moment because I still haven’t built it on GitHub Actions, which is the plan. On my private Windows 10 laptop, scheduling proved to be oddly hazardous with Task Scheduler so I had to deactivate it and run the bot manually every now and then.
If you are interested in the bot code, it is on GitHub.
You never know when a small piece of casual information develops to a
journey into something a lot bigger. This time, it was a remark by a
local cheese seller.
A notebook on how to search protected foodstuff names from the semantic repository of EU publications with SPARQL, and how to find their product description document. Includes a Shiny app to select product links from a small subset.
Walking is fun. When there is something to look at (or listen to), it is even funnier. Urban tree walks are popular – see e.g. TreeTalk – and in Helsinki there are over 50K planted trees to stand by and admire. Besides, there are roughly 12K park roads to stroll around. In most cases, these two come together. More inclined to man-made stuff like buildings? The register of buildings protected in the plan of the city of Helsinki has nearly 5K rows.
Where to go? One option is first to choose a district.
No matter what you are up to these days, you better have a mobile app for planning, navigation, and information. Thanks to the fairly new shinyMobile library, former desktop-only R Shiny web applications can now easily be modified to mobile-friendly ones. In this app, by district, I added several layers of Helsinki-related data points to a standard OpenStreetMap base map: park roads (in brown), planted trees (opaque green), protected buildings (orange), and City Bike stations (biggish yellow circles). Hint: click a bike station. After a second or two, it shows the number of available bikes.
The default district of the app is Kluuvi, the commercial centre of Helsinki. Fun fact: geographically, this area is a gloe lake (kluuvi), the final stage in the process where a bay in the sea turns into a freshwater lake due to post-glacial rebound. Select another district from the hamburger icon top left.
For some reason, the granularity of Helsinki park roads is amazingly high. To demonstrate this, there is a separate tab for just park roads, with a histogram
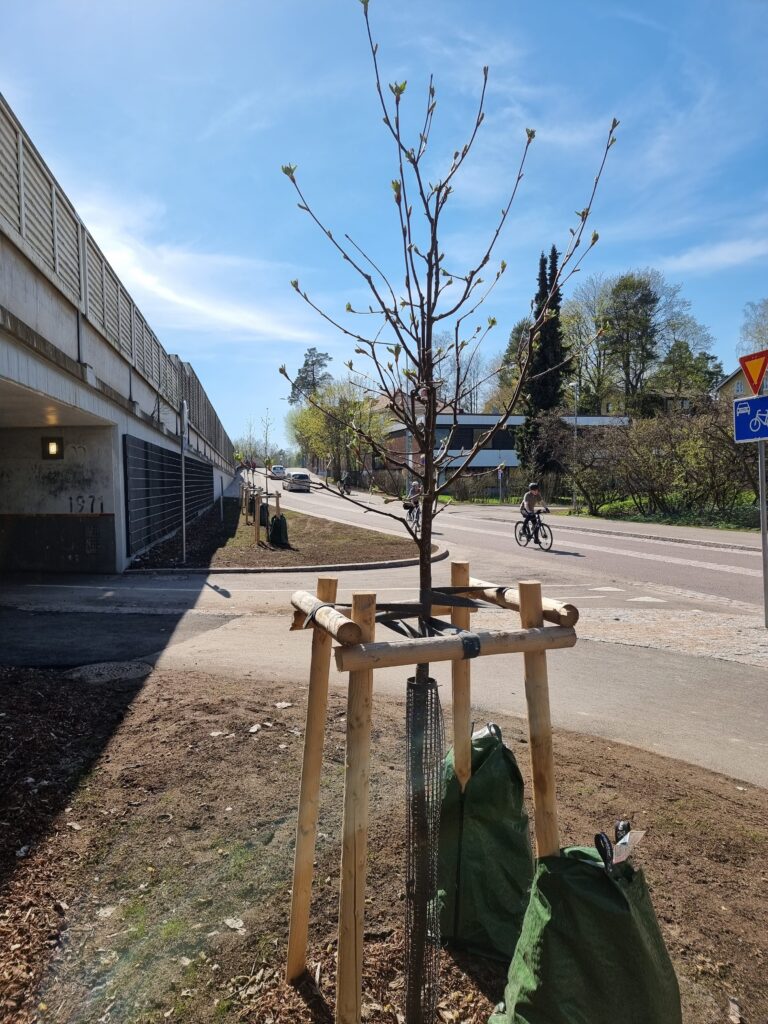
Two years back, my nearest planted tree was an Allegheny service berry. Since last fall, when the first bicycle boulevard of Helsinki took shape, there are new trees that grow ever nearer (I guess). But, they are not in the urban tree database yet, so I don’t know their species, nor their coordinates.
Planted trees by the Kulosaaren puistotie biking boulevard
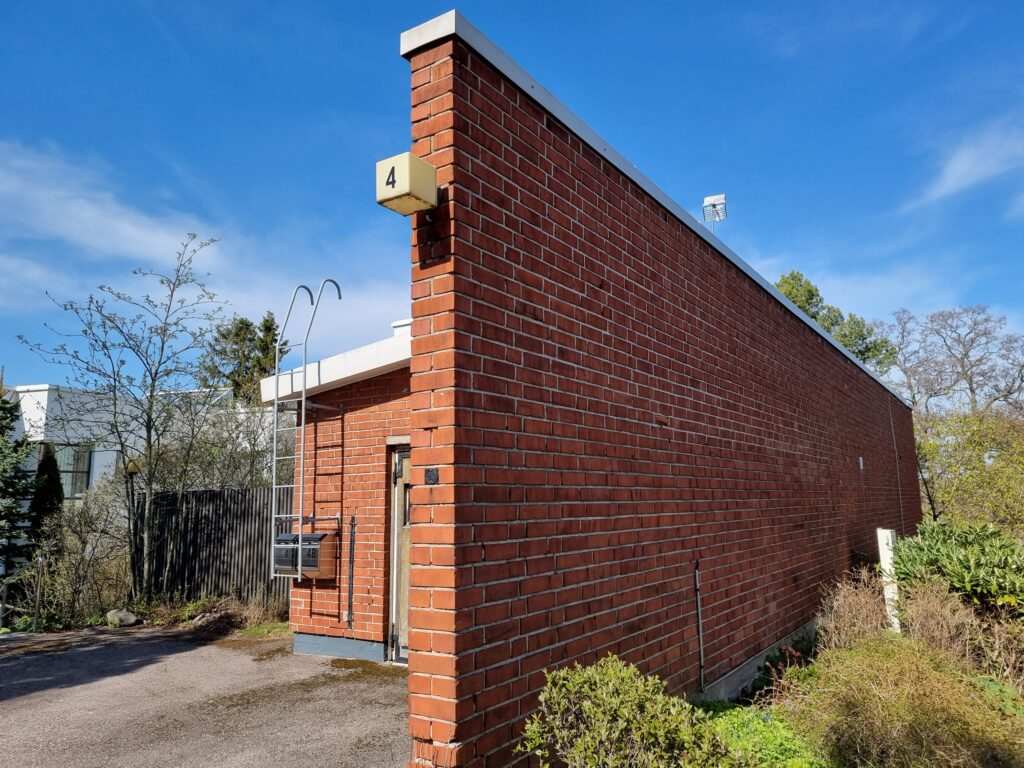
Almost all of the protected buildings in Helsinki are just that, separate buildings (rakennus). However, there are some intriguing exceptions. One of them is a protected facade. There is only one of those in the database – and it is part of our house!
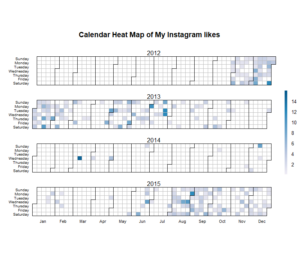
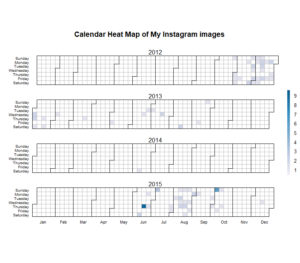
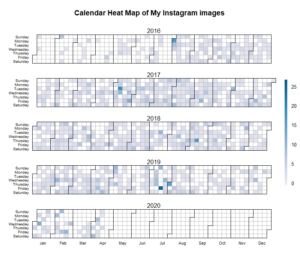
The other day I requested my data from Instagram where I have had a public account since late 2012. Within one hour the data was ready for download. In my case, it was roughly 500 MB worth of JPG photos, MP4 videos, and metadata as JSON files.
What was perhaps a small surprise was that the likes data was not reciprocal. I have now detailed information about whose photos I have liked and when but who has liked mine? No record. The little I have looked at the Instagram API, you cannot fetch this information via it either.
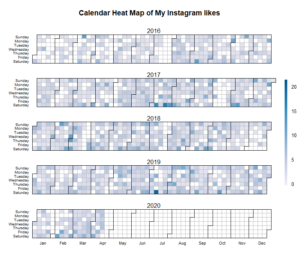
Below, as two separate images, is my liking behaviour over the years rendered as a calendar heatmap. The R code is on Github. Just about the only bigger thing I needed to do to the Instagram data was to fiddle with the data types so that I could input dates to the calendar function by Paul Bleicher.
What about my own postings?
My first Instagram years I spent mostly watching, then gradually liking a bit more. It took some time before I started to contribute myself but after that, it’s been a rather steady stream of photos at a rate of 2 per day in average. Actually, somewhat under 2 because the original data doesn’t include zero-image dates.
Anyway, what are the photos about? Time to some elementary ML.
Something I was not aware of is that, following the concept of transfer learning, you can directly use pre-trained models to classify images. The most popular models are available via the Keras Applications API.
I found Transfer Learning in Keras with Computer Vision Models by Jason Brownlee to be a good hands-on introduction to the topic. The model used here for classification, VGG16, is popular for learning purposes I’m told. I also learned that VGG16 isn’t state-of-the-art any longer so I shouldn’t expect it to give anywhere near accurate results except perhaps in some limited classes. However, as it turned out, using the model against my images was an eye-opener, and a funny one at that!
I have a Windows machine and have been using Anaconda a little already so to get all that was still missing from the setup, Installing a Python Based Machine Learning Environment in Windows 10 by Frank Ceballos worked very well. Unlike Frank I prefer Jupyter Notebooks over the Spyder IDE but following his advice I first checked in its console that all packages were installed correctly. However, for coding I open Anaconda Navigator, select the PythonCPU environment I made, and launch Notebook.
In this ~13 MB Notebook I first print out a manually curated selection of some 90 images, their most likely class label according to the model, and its probability. Then, for the sake of statistics I gather all labels, and count the most frequent ones. I didn’t clock but the latter one took at least what felt like half an hour on my Lenovo ThinkPad X1 Carbon (Intel Core i7 CPU 18GB RAM)
As you can see from the individual images, if the photo features an animal and not much else, the model performs surprisingly well. Especially dogs seem to be well-trained (pun not intended) but other common mammals are not far behind. Other canines pose a challenge, see e.g. hare (37.17%) which is a jackal.
Among dog breeds, dalmatians are obviously easy, ditto chows. However, if the whole body is not visible, things get trickier. One notable exception in this respect is the pointer; almost exactly the right breed although you only see the head. At times, the dog hammer makes everything look like a nail, see wire-haired_fox_terrier (26.29%) !
From other animals, some species are universally easy. Chameleons, snails, lions, ibexes, bears, zebras… no other fauna quite resembles them – unless it’s a dog in a zebra suit! The weevil was almost too perfect for this exercise thanks to the solid white background.
Given the accuracy of labeling dogs, it baffled me why the model did not give notice at all to the gray poodle. Why instead an ashcan with 30% probability? Well, there is an ashcan in the lower left corner. A similar case is the moving_van (27.47%) where the by far most prominent object is a big mural of a bear. But, there is a van. What’s happening here? Is the lower left corner a hot spot of some kind?
In the code, by image, I retrieve the highest probability class with
label = label[0][0]
In these two photos, ashcan and van simply get a higher score than the other objects in the image. When I define
label = label[0][1]
the labels are returned as soft-coated_wheaten_terrier (28.72%) and bison (12.02%), respectively. Next highest probabilities that is, and now also with a dog breed. To continue, with
label = label[0][2]
the result is streetcar (7.90%) and Newfoundland (8.34%). In other words, we are not just ascending the probability tree but also moving towards slightly more abstract, or at least not so obvious, classes. Derived, if you wish.
The model cannot be fooled that easily. Parachute (69.60%) shows a piece of textile with two tropical birds, artistically drawn but still with distinct features of real-life bird species. No matter how much you lower the probability of the class, the model is adamant that the image is about texture, not animals: sleeping_bag (11.72%), pillow (8.84%), quilt (4.95%), shower_curtain (0.63%)
It is interesting how VGG16 reveals bits and pieces about its training set.
First of all, avian fauna is mostly American. The bird pic I lol’d the most at was boldly labelled bald_eagle (14.20%) The image shows a European starling up on a pine tree. Goldcrest is taken either a jacamar or hummingbird, depending on the angle, although with a lowish probability in both cases. Likewise, architectural classes tell about a society where the state-of-the-art construction for people to live in is a house, as it is in the US. This explains why local blocks of flats are grimly classed as prisons! What was also intriguing to notice was that images on commercial activities like various merchandise must have been well represented in training data. Otherwise I cannot understand why shoe_shop (84.31%) and butcher_shop (78.01%) were so spot on.
At first sight, on the level of all my 2000+ photographs, the VCC16 model does not seem to perform that good, which was expected. There are only so many clear images of animals. Yes, it is true that water is a frequent element in my shots, but lakeside and breakwater could have been elaborated on a bit more maybe, park_bench and stone_wall too. Yet, at the end of the day, I think that these top four labels do are quite accurate classes (although it’s mostly seaside rather than lakeside). And the rest? Some of them sound a bit odd.
Lines of text in the image is a hard nut to crack. Is it a book, book_jacket, menu, doormat, envelope, packet, or a web page? In my case it’s oftentimes a screenshot from a web page I guess. Besides, how would you classify an abstract and artsy image without any discernible shapes? There is no “right” class for them. That’s why the class can be anything really; maze, window_shade, fountain etc.
Let’s face it, I like to take (and post) obscure pictures. Especially if there is a shortage of dogs, benches, walls and water.
Stories about coding, travels, and history | Koodailua, matkoja ja historiaa