A movie that I’ve never seen myself but what apparently forms a Christmas Eve tradition in the US, inspired David Robinson to write a thorough and illustrative blog post about its network of characters. Like some commentators have already mentioned, his analysis is particularly interesting e.g. because of the way he parses and processes raw text with R.
I wanted to replicate David’s take. For it, I needed material that’s more familiar.
One of the well known group of characters in Finnish pre-1900 fiction is Seven Brothers by Aleksis Kivi. Published in 1870, the book is already copyright free, and available in plain text from Project Gutenberg.
Brothers form a tight group but how tight, actually? With whom did they speak? What else is there to find with some quick R plotting?
First I needed a list of all characters that say something.
In the text, dialog is marked by uppercase letters with a trailing full stop. Thanks to a compact synopsis I found (in Finnish) I noticed that the A-Z character class wouldn’t suffice in filtering all names.
names <- data_frame(raw = raw) %>%
  filter(grepl('^[A-ZÄÖ-]+\\.', raw)) %>%
  separate(raw, c("speaker","text"), sep = "\\.", extra = "drop") %>%
  group_by(speaker) %>%
  summarize(name = speaker[1]) %>%
  select(name)
Some of the names referred to a group of people (e.g. VELJEKSET) or other non-person (the false positive DAMAGE), so I excluded them. I also found one typo; KERO is not some person but in fact EERO.
This data frame I then wrote to file, added manually some descriptive text in English with help of the above mentioned synopsis, and read in again. Later on in the process, this information would be joined with the rest of the processed data.
Next, with some minor modifications to David’s script, the main parsing process.
What the script does is that it filters all-blank rows; detects rows that mark the beginning of a new chapter (luku in Finnish); keeps a cumulative count of chapters; separates the name of the speaker from the first line of his/her dialog; groups by chapter, and finally summarizes – which I found interesting, because I’d thought that summarize() would be of use only with numerical values.
lines <- data_frame(raw = raw) %>%
  filter(raw != "") %>%
  mutate(is_chap = str_detect(raw, " LUKU"),
         chapter = cumsum(is_chap)) %>%
  filter(!is_chap) %>%
  mutate(raw_speaker = gsub("^([A-ZÄÖ-]+)(\\.)(.*)", "\\1%\\3", raw, perl=TRUE)) %>%
  separate(raw_speaker, c("speaker", "dialogue"), sep = "%", extra = "drop",
           fill = "left") %>%
  group_by(chapter, line = cumsum(!is.na(speaker))) %>%
  summarize(name = speaker[1], dialogue = str_c(dialogue, collapse = " "))
Inner_join()‘ing lines with names.df by their common variable name, only the relevant rows are kept.
lines <- lines %>%
  inner_join(names.df) %>%
  mutate(character = paste0(name, " (", type, ")"))
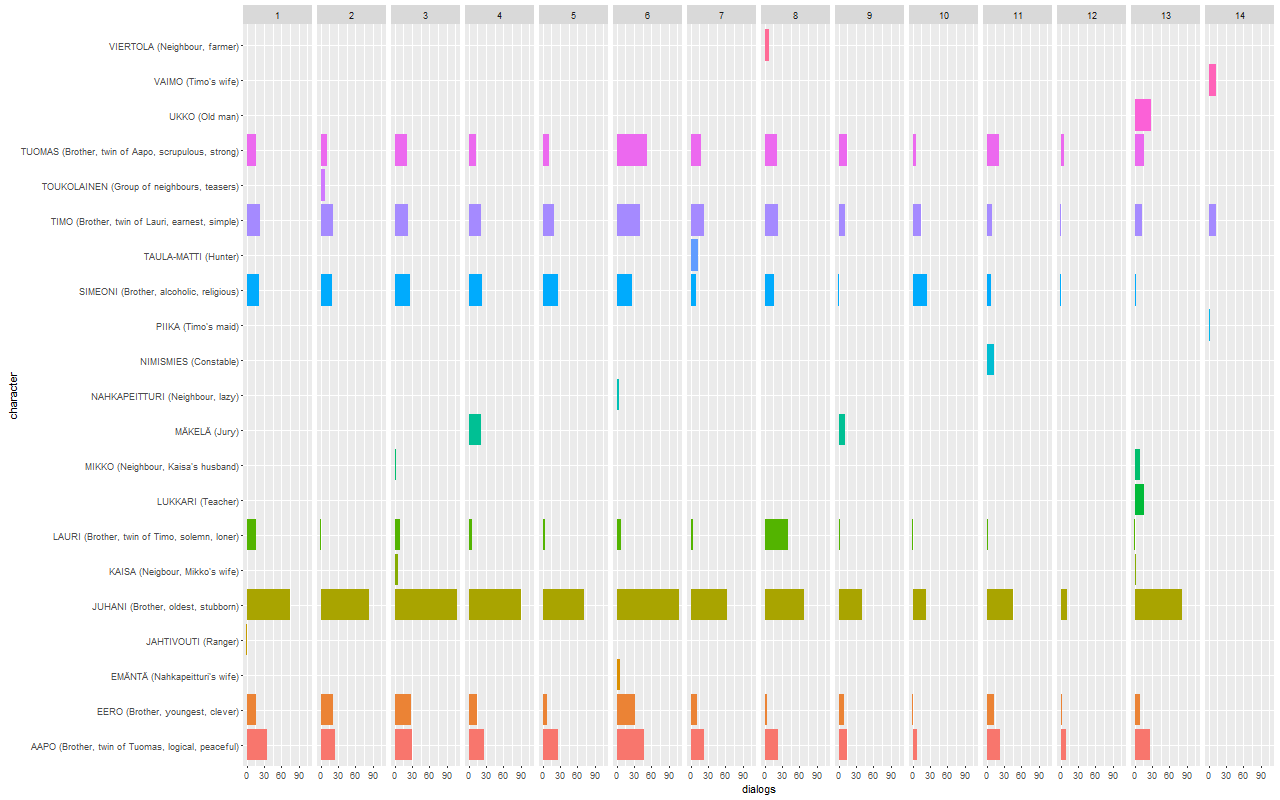
How much do the brothers speak across the chapters?
by_name_chap <- lines %>%
  count(chapter, character)

ggplot(by_name_chap, aes(x=character, y=dialogs, fill=character))+
  geom_bar(stat = "identity") +
  facet_grid(. ~ chapter) +
  coord_flip() +
  theme(legend.position="none")
From the facetted bar chart we’ll notice that Juhani, the oldest brother, is also the most talkative one. He remains silent only in the very last chapter, the epilogue.
Whenever we have a matrix, it’s worth trying to cluster it.
– says David, so let’s follow his advice.
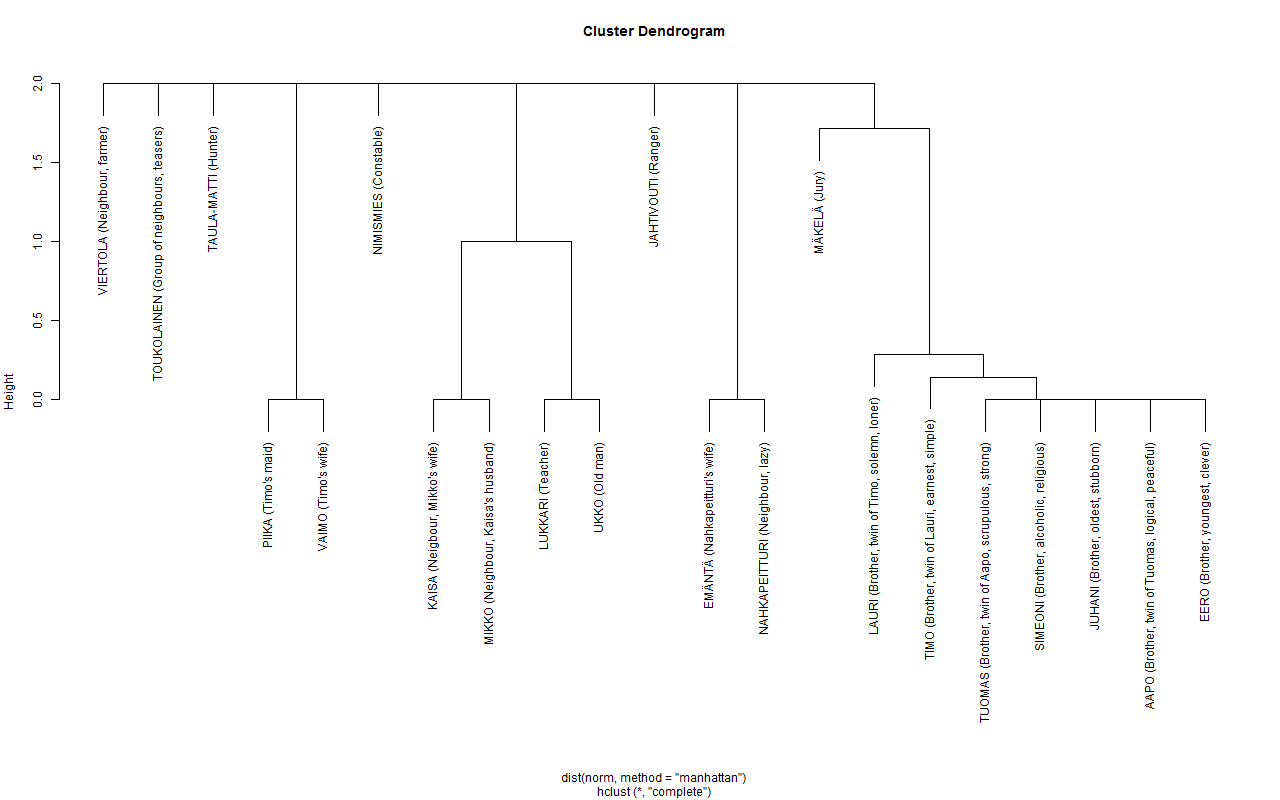
Brothers are mostly together, which is not a surprise. Lauri does not talk much, and Timo has got his own chapter. These facts might have influenced to their having a separate branch each. The few other people that have a say in the book, form their own hierarchies.
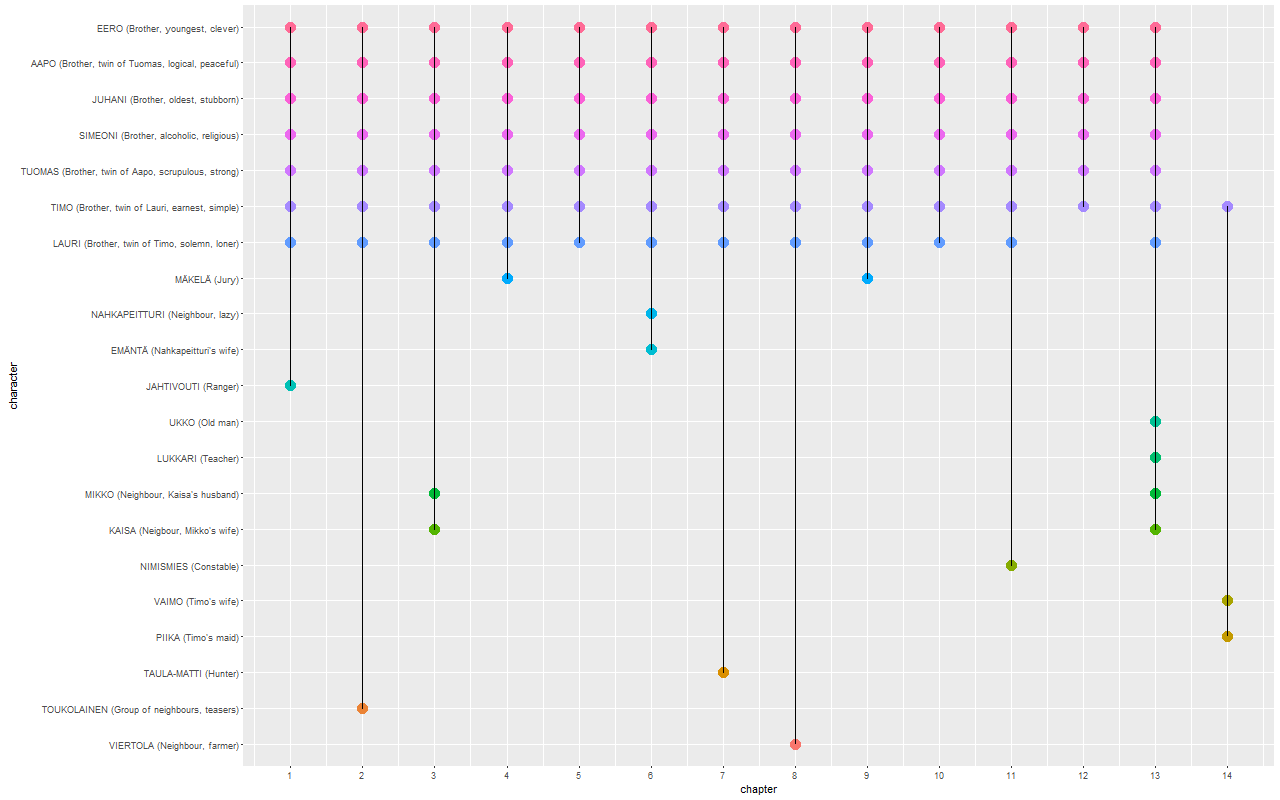
Next David shows how this ordered tree can be transformed to a scatterplot. What a neat way to make a timeline! Because of the great number of different permutations of pairs, his example movie is visually more interesting in this respect than Seven Brothers. Still, even here the plot acts nicely as a snapshot of the storyline.
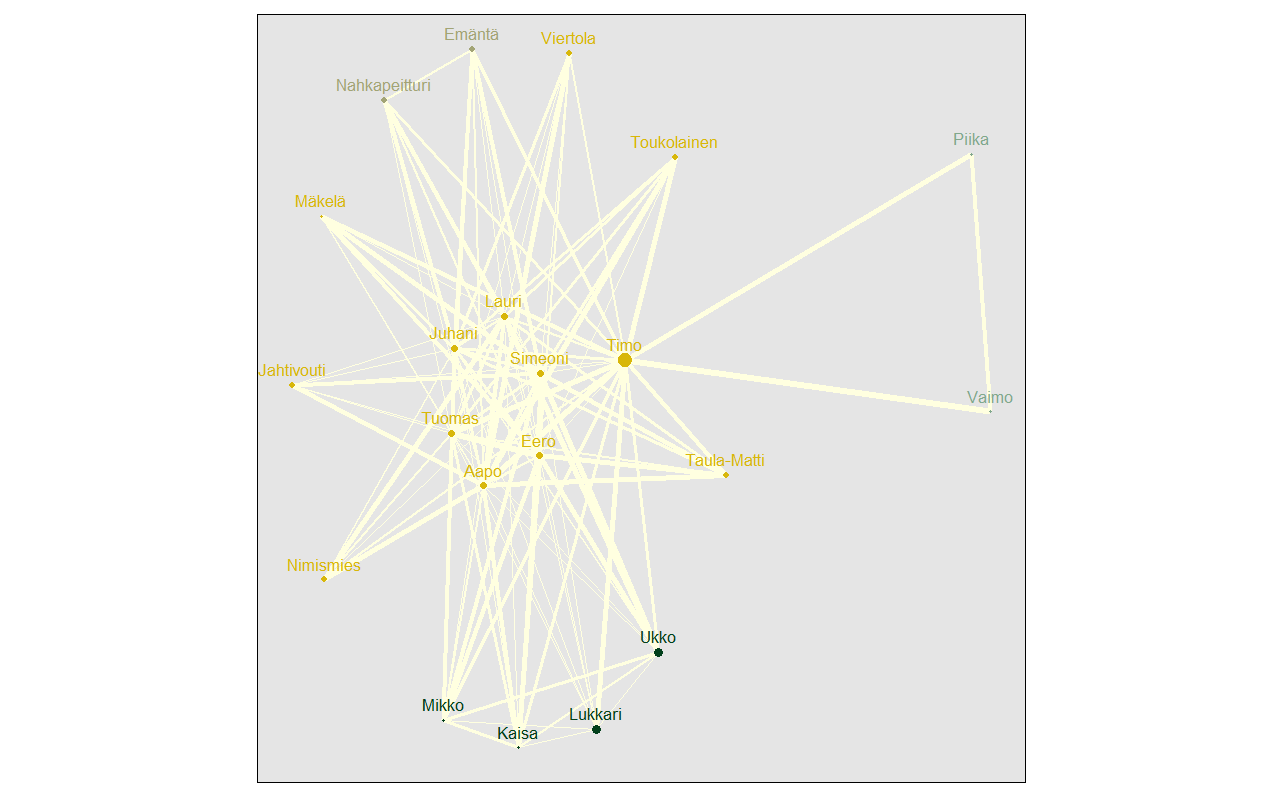
The network graph of brothers and their allies does not reveal anything overly exciting. This part of the analysis I took merely as an exercise in plotting the network with the new geomnet R package.
# Adjacency matrix
cooccur <- name_chap_matrix %*% t(name_chap_matrix)

library(igraph)

# Define network from the matrix, plus few attributes
g <- graph.adjacency(cooccur, weighted = TRUE, mode = "undirected", diag = FALSE)
V(g)$lec_community <- as.character(leading.eigenvector.community(g)$membership)
V(g)$centrality <- igraph::betweenness(g, directed = F)
E(g)$weight <- runif(ecount(g))
V(g)$Label <- V(g)$name

# Plot network
library(geomnet)

# From the igraph object, two dataframes: vertices and edges, respectively
gV <- get.data.frame(g, what=c("vertices"))
gE <- get.data.frame(g, what=c("edges"))

# Merge edges and vertices
gnet <- merge(
  gE, gV,
  by.x = "from", by.y = "Label", all = TRUE
)

# Add a new variable, a pretty-print variant of names
gnet$shortname <- sapply(gnet$name, function(x) {
  n <- strsplit(x, " \\(")[[1]][1]
  nwords <- strsplit(n, "\\-")[[1]]
  paste0(substring(nwords, 1, 1),
         tolower(substring(nwords, 2)),
         collapse = "-")
})

# Colour palette from Wes Anderson's movie Castell Cavalcanti
# https://github.com/karthik/wesanderson/blob/master/R/colors.R
wesanderson.cavalcanti <- c("#D8B70A", "#02401B", "#A2A475", "#81A88D", "#972D15")

p <- ggplot(data = gnet,
            aes(from_id = from, to_id = to)) +
  geom_net(
    ecolour = "lightyellow", # edge colour
    aes(
      colour = lec_community,
      group = lec_community,
      fontsize = 6,
      linewidth = weight * 10 / 5 + 0.2,
      size = centrality,
      label = shortname
    ),
    show.legend = F,
    vjust = -0.75, alpha = 0.4,
    layout = 'fruchtermanreingold'
  )

p + theme_net() +
  theme(panel.background = element_rect(fill = "gray90"),
        plot.margin = unit(c(1, 1, 1, 1), "lines")) +
  scale_color_manual(values = wesanderson.cavalcanti[1:length(unique(gnet$lec_community))]) +
  guides(linetype = FALSE)
The community detection algorithm of igraph found four communities. In the network graph, these are shown with different colours. Most of the characters in Seven Brothers belong to the same community, but there are few loners.
The size of the node tells about the centrality of the person. Timo seems to be influential, probably because he is the only one from the brothers that shares a chapter with his wife and maid.
The thicker the edge, i.e. the line connecting two nodes, the more weight there is. I assume that here weight is simply a measure of co-appearance.